
|
| Home | Accessibility | Courses | Diary | The Mouth | Forum | Resources | Site Map | About Us | Contact |
| For 2023 (and 2024 ...) - we are now fully retired from IT training. We have made many, many friends over 25 years of teaching about Python, Tcl, Perl, PHP, Lua, Java, C and C++ - and MySQL, Linux and Solaris/SunOS too. Our training notes are now very much out of date, but due to upward compatability most of our examples remain operational and even relevant ad you are welcome to make us if them "as seen" and at your own risk. Lisa and I (Graham) now live in what was our training centre in Melksham - happy to meet with former delegates here - but do check ahead before coming round. We are far from inactive - rather, enjoying the times that we are retired but still healthy enough in mind and body to be active! I am also active in many other area and still look after a lot of web sites - you can find an index ((here)) |
Toplevel and ScrollBar
Posted by Achilles (Achilles), 26 March 2005
Hi ,I am facing a strange prb
 , all I want to develop UI for USER to enter data corresponding to each field . Toplevel pop from MAIN WINDOW as an event and then I use a Label and Entry widget inside Canvas .But the problem is that i AM NOT ABLE TO LINK SCROLL BAR WITH THE CANVAS AS SUCH MY DATA IS not BEING SHOWN PROPERLY
  .
.HERE is the structure within toplevel:
TOPLEVEL [
FRAME [
CANVAS(C) [ LABEL + ENTRY WIDGET ] +
SCROLLBAR(S)
]
]
the SCROLLBAR (s) is meant for CANVAS (c). Canvas(c) contains the LABEL + ENTRY widget and these two are being used for data entry by the USER.
Here's the CODE :
global SIGNAL_name VAR elements
set f [toplevel .trace -background grey -height 9c -width 6c -takefocus 1]
wm transient .trace . ;#restricting toplevel @ top
wm title .trace "TRACE"
grab $f ;#restricting events to toplevel
#adding a Frame to Toplevel
frame $f.f1 -highlightbackground black -highlightthickness 1
pack $f.f1 -side top -fill both -expand 1
scrollbar $f.f1.scroLLy -command { .trace.f1.signals yview } -width 8
canvas $f.f1.signals -relief sunken -width 4c -height 5c \
-borderwidth 2 -yscrollcommand { .trace.f1.scroLLy set }
pack $f.f1.signals -side left -fill y
pack $f.f1.scroLLy -side left -fill y
set temp1 [array startsearch VAR]
set temp [array get SIGNAL_name]
for {set i 0} {$i < $elements } {incr i} {
set temp3 [ array nextelement VAR $temp1 ]
$f.f1.signals create text 2c ${i}c -text "$SIGNAL_name($temp3) $temp3"
}
------------------
all i want to know is how can I show a data using canvas( or any thing which has scroll bar option ) in toplevel
Posted by admin (Graham Ellis), 27 March 2005
You're using a lot of options there ... and I got a bit confused between the various bits and pieces. So here's an example of a 400 x 400 canvas of which we're viewing 300 x 200 in a top level widget in a frame - very much your structure. Tested, and it works. The only "extra" here is the oval I've drawn in the canvas so that I can really see that it's scrolling. Looks like this in action: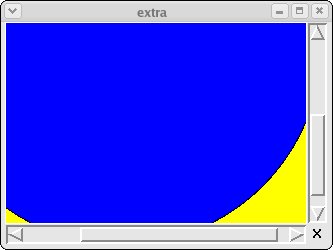
Code:
|
Posted by Achilles (Achilles), 28 March 2005
Thanks a lot Graham it solved half of my problem.The only thing i want to know is :
what widget can i use : which can accomodate both "Label" , "Entry" widgets along with a "SCROLLBAR" .
Posted by admin (Graham Ellis), 29 March 2005
on 03/28/05 at 20:44:19, Achilles wrote:
|
A frame
Posted by the_shannow (the_shannow), 9 June 2005
My aim is to make a scrolling graph (using BLT) with a horizontal scrollbar advancing as the points are being plotted. I used the exact same script as you did above, the only change i did was to insert in a BLT graph in the canvas instead of simply drawing a circle. The problem i gace is that the frame and the canvas inside it expand to the width of the graph. What i really want is the graph to be really long ( long enough ..so that the entire range of points can be plotted as and when they are available), but at a certain point i only want a subset of these points to get displayed. The effect I am aiming to achieve is that of a graph whose history can be seen simply by scrolling the horizontal scroll bar.My code: (which dosnt work
 )
)package require BLT
proc moveitx {args} {
eval ".fr.c xview $args"
set nowat [.fr.c xview]
eval ".fr.hscroll set $nowat"
}
frame .fr
canvas .fr.c -scrollregion { 0 0 800 800} -width 400
scrollbar .fr.hscroll -orient horizontal -command moveitx
pack .fr.hscroll -side bottom -fill x
.fr.hscroll set 0 0.075
pack .fr -fill both -expand true
grid .fr.c -sticky news
grid .fr.hscroll -sticky news
blt::graph .fr.c.gh
.fr.c.gh config -title {testing} -width 800
pack .fr.c.gh -padx 5 -pady 5
blt::vector xvec
blt::vector yvec
proc sleep {N} {
after [expr {int($N * 1000)}]
}
xvec set {}
yvec set {}
.fr.c.gh element create "Test" -xdata xvec -ydata yvec
set index "0"
for {set i 0} {$i < 25} {incr i} {
xvec append [expr $index+1]
yvec append [expr $index]
set gwidth [expr $gwidth +50]
set index [expr $index+1]
sleep 0.5
update
}
This page is a thread posted to the opentalk forum
at www.opentalk.org.uk and
archived here for reference. To jump to the archive index please
follow this link.
Other Forum Posts
Follow us on ...
 |  |
PH: 01144 1225 708225 • FAX: 01144 1225 793803 • EMAIL: info@wellho.net • WEB: http://www.wellho.net • SKYPE: wellho