
|
Training, Open Source Programming Languages |
| Home | Accessibility | Courses | The Mouth | Resources | Site Map | About Us | Contact |
| For 2023 (and 2024 ...) - we are now fully retired from IT training. We have made many, many friends over 25 years of teaching about Python, Tcl, Perl, PHP, Lua, Java, C and C++ - and MySQL, Linux and Solaris/SunOS too. Our training notes are now very much out of date, but due to upward compatability most of our examples remain operational and even relevant ad you are welcome to make us if them "as seen" and at your own risk. Lisa and I (Graham) now live in what was our training centre in Melksham - happy to meet with former delegates here - but do check ahead before coming round. We are far from inactive - rather, enjoying the times that we are retired but still healthy enough in mind and body to be active! I am also active in many other area and still look after a lot of web sites - you can find an index ((here)) |
|
A first graph with Matplotlib in Python
"A picture paints a thousand words" and in Python, you can paint a graph based picture using matplotlib. Matplotlib is massive - a huge range of facilities, a 2000 page manual if you print it out - yet if you know where to start "hello graphing world" is straightforward. Taking my previous blog example - [here], where I analysed 1 Gbyte of data and created a Json file with summary details, I've now gone on and added a graph showing the usage on a day by day basis of one of the hosts on our server. Extra code: import matplotlib.pyplot as pltAnd the output: 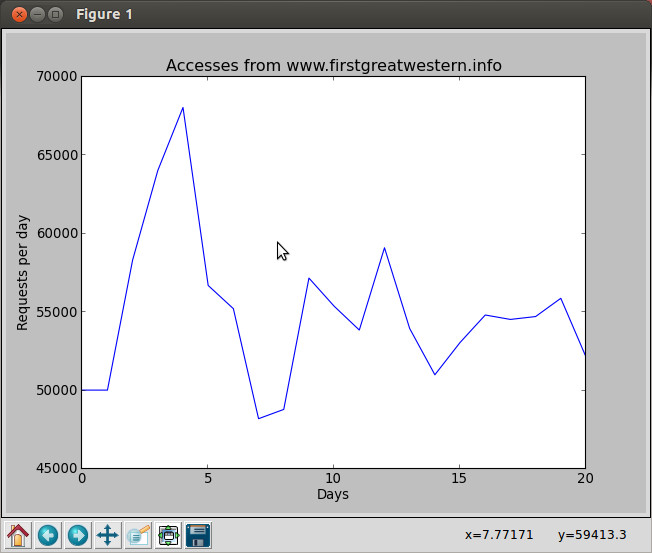 Complete code [here] My delegates for next week have asked me to show them how to get to Matplotlib from Python. If it turns out they want rather more, you'll see lote more examples appearing here in a day or two. My background is very much computer graphics and I will welcome the opportunity! (written 2015-02-22) Associated topics are indexed as below, or enter http://melksh.am/nnnn for individual articles Y118 - Python - numpy, scipy and matplotlib[2990] What are numpy and scipy? - (2010-10-09) [2991] Loading and saving data - Python / numpy - (2010-10-09) [2992] Matplotlib - graphing in Python - teaching examples - (2010-10-10) [2993] Arrays v Lists - what is the difference, why use one or the other - (2010-10-10) [2997] 3D graphics - web site usage - simple matplotlib and python example - (2010-10-12) [3554] Learning more about our web site - and learning how to learn about yours - (2011-12-17) [4445] Graphing presentations in Python - huge data, numpy and matplotlib - (2015-02-28)
Some other Articles
Elements of an exception in Python - try, except, else, finallySeventh stay away this year - and it's still only February! Mutable v Immuatble objects in Python, and the implication Reading command line parameters in Python A first graph with Matplotlib in Python Json is the new marshall, pickle and cPickle / Python Loving programming in Python - and ready to teach YOU how Adding a PHP build option, rotating an image based on camera data, and a new look at thumbnails in PHP Accessing a MySQL database from Python with mysql.connector Images of our rail promotion campaign |
4759 posts, page by page
Link to page ... 1, 2, 3, 4, 5, 6, 7, 8, 9, 10, 11, 12, 13, 14, 15, 16, 17, 18, 19, 20, 21, 22, 23, 24, 25, 26, 27, 28, 29, 30, 31, 32, 33, 34, 35, 36, 37, 38, 39, 40, 41, 42, 43, 44, 45, 46, 47, 48, 49, 50, 51, 52, 53, 54, 55, 56, 57, 58, 59, 60, 61, 62, 63, 64, 65, 66, 67, 68, 69, 70, 71, 72, 73, 74, 75, 76, 77, 78, 79, 80, 81, 82, 83, 84, 85, 86, 87, 88, 89, 90, 91, 92, 93, 94, 95, 96 at 50 posts per pageThis is a page archived from The Horse's Mouth at http://www.wellho.net/horse/ - the diary and writings of Graham Ellis. Every attempt was made to provide current information at the time the page was written, but things do move forward in our business - new software releases, price changes, new techniques. Please check back via our main site for current courses, prices, versions, etc - any mention of a price in "The Horse's Mouth" cannot be taken as an offer to supply at that price.
Link to Ezine home page (for reading).
Link to Blogging home page (to add comments).
PH: 01144 1225 708225 • EMAIL: info@wellho.net • WEB: http://www.wellho.net • SKYPE: wellho
PAGE: http://www.wellho.net/mouth/4440_A-f ... ython.html • PAGE BUILT: Sun Oct 11 16:07:41 2020 • BUILD SYSTEM: JelliaJamb