
|
Training, Open Source Programming Languages |
| Home | Accessibility | Courses | The Mouth | Resources | Site Map | About Us | Contact |
| For 2023 (and 2024 ...) - we are now fully retired from IT training. We have made many, many friends over 25 years of teaching about Python, Tcl, Perl, PHP, Lua, Java, C and C++ - and MySQL, Linux and Solaris/SunOS too. Our training notes are now very much out of date, but due to upward compatability most of our examples remain operational and even relevant ad you are welcome to make us if them "as seen" and at your own risk. Lisa and I (Graham) now live in what was our training centre in Melksham - happy to meet with former delegates here - but do check ahead before coming round. We are far from inactive - rather, enjoying the times that we are retired but still healthy enough in mind and body to be active! I am also active in many other area and still look after a lot of web sites - you can find an index ((here)) |
|
Apache httpd Server Status - monitoring your server
Do you want to know how your Apache httpd web server is running? The Server Status tool - a standard module supplied with the httpd daemon - can give you a lot of information, but by default it's turned off. Turning it on ... A work of caution before you turn it on. You do NOT want this to be world visible, so you'll want to limit the access. 1. In httpd.conf, remove the comment (#) in front of the httpd-info.conf line: Include conf/extra/httpd-info.conf2. In extra/httpd-info.conf, remove comments (#) in front of the server status lines AND SET UP YOUR OWN DENY RULES: <Location /server-status>The IP addresses listed are our specific client (browsing) locations, and the server itself, which responds in our case to several IP addressed in the 83.170 range; the server itself needs to get the report for its regular logging via scripts such as the one supplied (very old) with httpd sources, or [this one]. 3. Having limited where the data can be seen from, you can turn full status reports on: ExtendedStatus OnUsing it 1. By default, you get a full report when you visit the URL that you've set up above 2. You many add ?refresh=nn to the URL, where "nn" is the number of seconds between reports, and it will the autorefresh 3. As an alternative, you may add ?auto to the URL, in which case you'll gt a shortened report in an easier format for automated tools to use. Reading the result 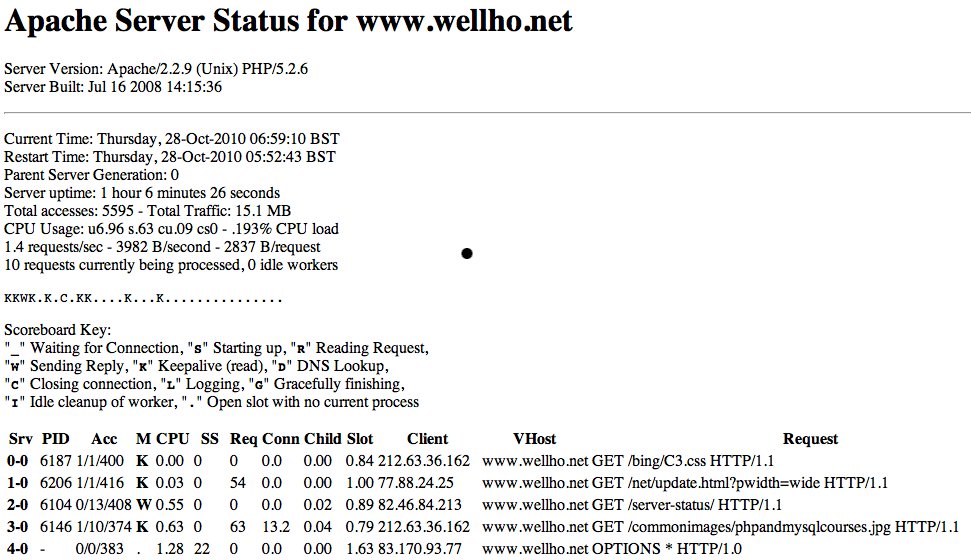 Here's a snapshot of our live server ... at a very quiet time. I had restarted it (part of the cleanups and work I was doing to write this series of articles) and hour previously, and there had been 5595 requests in that time. The processor was pretty close to being idle (but, beware, this is only the Apache usage, not the cpu as a whole) and the total traffic had only been about 15 Mbytes. Here's a snapshot of our live server ... at a very quiet time. I had restarted it (part of the cleanups and work I was doing to write this series of articles) and hour previously, and there had been 5595 requests in that time. The processor was pretty close to being idle (but, beware, this is only the Apache usage, not the cpu as a whole) and the total traffic had only been about 15 Mbytes.One process had completed and was being closed One process was actually sending a reply (the read having been completed) Eight processes had completed, but were being kept alive in case of other requests from the same client and there were 25 open slots Looking at the process by process report, you can see the details of the most recent request on each slot (the active one in the case of the working process). You'll notice a strange OPTIONS line on slot 4 ... that's standard in Apache 2.2 and it's how the server tells its own processes to neatly close out. If you're watching a server log file with tail -f and it goes quiet, you'll see a whole bunch of these pop up. Much of the further information about each slot is cumulative since the process in it was started; it does not relate to just the current or most recent use. (written 2010-10-28) Associated topics are indexed as below, or enter http://melksh.am/nnnn for individual articles A692 - Web Application Deployment - Monitoring and load testing your server[1718] Increasing Java Virtual Machine memory for Tomcat - (2008-07-24) [2079] Java - Memory Allocation and garbage collection - (2009-03-14) [2080] Using ApacheBench and jconsole to test and monitor Tomcat - (2009-03-14) [2082] Jmeter - a first test case - (2009-03-14) [2272] Monitoring and loading tools for testing Apache Tomcat - (2009-07-07) [3015] Logging the performance of the Apache httpd web server - (2010-10-25) [3027] Server logs - drawing a graph of gathered data - (2010-11-03) A606 - Web Application Deployment - Apache httpd - log files and log tools [376] What brings people to my web site? - (2005-07-13) [1237] What proportion of our web traffic is robots? - (2007-06-19) [1503] Web page (http) error status 405 - (2008-01-12) [1598] Every link has two ends - fixing 404s at the recipient - (2008-04-02) [1656] Be careful of misreading server statistics - (2008-05-28) [1761] Logging Cookies with the Apache httpd web server - (2008-08-20) [1780] Server overloading - turns out to be feof in PHP - (2008-09-01) [1796] libwww-perl and Indy Library in your server logs? - (2008-09-13) [3087] Making the most of critical emails - reading behind the scene - (2010-12-16) [3443] Getting more log information from the Apache http web server - (2011-09-16) [3447] Needle in a haystack - finding the web server overload - (2011-09-18) [3491] Who is knocking at your web site door? Are you well set up to deal with allcomers? - (2011-10-21) [3554] Learning more about our web site - and learning how to learn about yours - (2011-12-17) [3670] Reading Google Analytics results, based on the relative populations of countries - (2012-03-24) [3974] TV show appearance - how does it effect your web site? - (2013-01-13) [3984] 20 minutes in to our 15 minutes of fame - (2013-01-20) [4307] Identifying and clearing denial of service attacks on your Apache server - (2014-09-27) [4404] Which (virtual) host was visited? Tuning Apache log files, and Python analysis - (2015-01-23) [4491] Web Server Admin - some of those things that happen, and solutions - (2015-05-10)
Some other Articles
Autumn walk from BowerhillRetaining web site visitors - reducing the one page wonders Courses for late 2010 and early 2011 Handling (expanding) tabs in PHP Apache httpd Server Status - monitoring your server Tuning Apache httpd and Tomcat to work well together Seventh day traveller on the six day railway The legal considerations of your web presence - revisited Well House Manor - the next six years |
4759 posts, page by page
Link to page ... 1, 2, 3, 4, 5, 6, 7, 8, 9, 10, 11, 12, 13, 14, 15, 16, 17, 18, 19, 20, 21, 22, 23, 24, 25, 26, 27, 28, 29, 30, 31, 32, 33, 34, 35, 36, 37, 38, 39, 40, 41, 42, 43, 44, 45, 46, 47, 48, 49, 50, 51, 52, 53, 54, 55, 56, 57, 58, 59, 60, 61, 62, 63, 64, 65, 66, 67, 68, 69, 70, 71, 72, 73, 74, 75, 76, 77, 78, 79, 80, 81, 82, 83, 84, 85, 86, 87, 88, 89, 90, 91, 92, 93, 94, 95, 96 at 50 posts per pageThis is a page archived from The Horse's Mouth at http://www.wellho.net/horse/ - the diary and writings of Graham Ellis. Every attempt was made to provide current information at the time the page was written, but things do move forward in our business - new software releases, price changes, new techniques. Please check back via our main site for current courses, prices, versions, etc - any mention of a price in "The Horse's Mouth" cannot be taken as an offer to supply at that price.
Link to Ezine home page (for reading).
Link to Blogging home page (to add comments).
PH: 01144 1225 708225 • EMAIL: info@wellho.net • WEB: http://www.wellho.net • SKYPE: wellho
PAGE: http://www.wellho.net/mouth/3019_Apa ... erver.html • PAGE BUILT: Sun Oct 11 16:07:41 2020 • BUILD SYSTEM: JelliaJamb