
|
Training, Open Source Programming Languages |
| Home | Accessibility | Courses | The Mouth | Resources | Site Map | About Us | Contact |
| For 2023 (and 2024 ...) - we are now fully retired from IT training. We have made many, many friends over 25 years of teaching about Python, Tcl, Perl, PHP, Lua, Java, C and C++ - and MySQL, Linux and Solaris/SunOS too. Our training notes are now very much out of date, but due to upward compatability most of our examples remain operational and even relevant ad you are welcome to make us if them "as seen" and at your own risk. Lisa and I (Graham) now live in what was our training centre in Melksham - happy to meet with former delegates here - but do check ahead before coming round. We are far from inactive - rather, enjoying the times that we are retired but still healthy enough in mind and body to be active! I am also active in many other area and still look after a lot of web sites - you can find an index ((here)) |
|
Jmeter - a first test case
Would you like to see how your web site performs under load? I mentioned ApacheBench (ab) in a recent post, but you can also use a tool like Jmeter. And although Jmeter is written in and runs in Java, you can use it to look at the performance of other servers and network resources too. 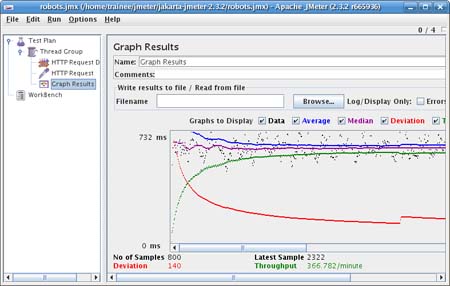 In famous "Blue Peter" jargon, 'here is one I put in the oven earlier' ... In famous "Blue Peter" jargon, 'here is one I put in the oven earlier' ...... and the reason I put one in the oven earlier is because like all things Java, the documentation and setup looks very complicated at first. How did I set this up? 0. I fired up Jmeter - previously downloaded and unpacked - making sure that a Sun JRE was 'top dog' in my PATH. 1. I started a new TEST PLAN 2. I added a THREAD GROUP (4 users, 4 seconds ramp up, 200 loops) 3. I added an HTTP REQUESTS DEFAULT within Config Element (wellho.net as the server but please use your own if you're following this!) 4. I added an HTTP REQUEST within Samplers (path to /robots.txt) 5. I added a GRAPH RESULTS under listener 6. I saved the configuration as a .jmx file (robots.jmx) and I chose "run" ... Let me fill you in on those results. There were 800 samples taken as I asked for 200 sets of 4 samples, and I spread the sample sets out over 4 seconds apiece, so the total run time was about 3 minutes. The sprinkling of black dots represent the individual samples and how long each of them took, with the blue line showing the average time and the purple line showing the median (time of the 50 percentile sample, which is a little bit different). The red and green lines are on different scales - the red line showing the deviation or variance which was high at first (probably because the first few samples would have been slow, the later samples consistently faster) and the green lines shows the throughput achieved - that starts low and rises, again because of early slow samples. Right. Here is a stern lesson. Do NOT run Jmeter against a server that you don't own / don't have permission to try it out on. Tests like the one I have done above are cruel and can bring a server to its knees very quickly, so using Jmeter is a way to make yourself very unpopular! BUT if you're configuring a new environment it's a great tool! I have only started to scratch the surface here ... as you put your first test plan together, follow what I have done on your own server .... and as you put your second plan together, have a look at the manual that covers it from Apache - in particular chapter 5 - here. You'll find it's very clever in terms of logging in, posted data, handling cookies and doing a lot more to simulate real traffic. Proceed further and you'll find that you can combine thread groups that are being run by different instances of Jmeter into a single report, and get some very sophisticated load testing running. (written 2009-03-14, updated 2012-10-13) Associated topics are indexed as below, or enter http://melksh.am/nnnn for individual articles A912 - Web Application Deployment - Upgrading and tuning Tomcat[1377] Load Balancing with Apache mod_jk (httpd/Tomcat) - (2007-10-02) [1718] Increasing Java Virtual Machine memory for Tomcat - (2008-07-24) [1908] Java CLASSPATH explained - (2008-11-26) [2060] Database connection Pooling, SSL, and command line deployment - httpd and Tomcat - (2009-03-01) [3018] Tuning Apache httpd and Tomcat to work well together - (2010-10-27) A692 - Web Application Deployment - Monitoring and load testing your server [2079] Java - Memory Allocation and garbage collection - (2009-03-14) [2080] Using ApacheBench and jconsole to test and monitor Tomcat - (2009-03-14) [2272] Monitoring and loading tools for testing Apache Tomcat - (2009-07-07) [3015] Logging the performance of the Apache httpd web server - (2010-10-25) [3019] Apache httpd Server Status - monitoring your server - (2010-10-28) [3027] Server logs - drawing a graph of gathered data - (2010-11-03) A506 - Web Application Deployment - Java - Installing and Deploying optional Technologies [2081] Connecting jconsole remotely - the principles - (2009-03-14) [3043] Gathering information - logging - with log4j. First steps. - (2010-11-12)
Some other Articles
C Programming v Learning to Program in C. Which course?MySQL - licensing issues, even with using the name Books and distance learning from Well House Consultants? Do you support a decent train service? Please sign up! Jmeter - a first test case A lot has changed - but the memory lingers on Why put Apache httpd in front of Apache Tomcat |
4759 posts, page by page
Link to page ... 1, 2, 3, 4, 5, 6, 7, 8, 9, 10, 11, 12, 13, 14, 15, 16, 17, 18, 19, 20, 21, 22, 23, 24, 25, 26, 27, 28, 29, 30, 31, 32, 33, 34, 35, 36, 37, 38, 39, 40, 41, 42, 43, 44, 45, 46, 47, 48, 49, 50, 51, 52, 53, 54, 55, 56, 57, 58, 59, 60, 61, 62, 63, 64, 65, 66, 67, 68, 69, 70, 71, 72, 73, 74, 75, 76, 77, 78, 79, 80, 81, 82, 83, 84, 85, 86, 87, 88, 89, 90, 91, 92, 93, 94, 95, 96 at 50 posts per pageThis is a page archived from The Horse's Mouth at http://www.wellho.net/horse/ - the diary and writings of Graham Ellis. Every attempt was made to provide current information at the time the page was written, but things do move forward in our business - new software releases, price changes, new techniques. Please check back via our main site for current courses, prices, versions, etc - any mention of a price in "The Horse's Mouth" cannot be taken as an offer to supply at that price.
Link to Ezine home page (for reading).
Link to Blogging home page (to add comments).
PH: 01144 1225 708225 • EMAIL: info@wellho.net • WEB: http://www.wellho.net • SKYPE: wellho
PAGE: http://www.wellho.net/mouth/2082_Jme ... -case.html • PAGE BUILT: Sun Oct 11 16:07:41 2020 • BUILD SYSTEM: JelliaJamb