
|
Training, Open Source Programming Languages |
| Home | Accessibility | Courses | The Mouth | Resources | Site Map | About Us | Contact |
| For 2023 (and 2024 ...) - we are now fully retired from IT training. We have made many, many friends over 25 years of teaching about Python, Tcl, Perl, PHP, Lua, Java, C and C++ - and MySQL, Linux and Solaris/SunOS too. Our training notes are now very much out of date, but due to upward compatability most of our examples remain operational and even relevant ad you are welcome to make us if them "as seen" and at your own risk. Lisa and I (Graham) now live in what was our training centre in Melksham - happy to meet with former delegates here - but do check ahead before coming round. We are far from inactive - rather, enjoying the times that we are retired but still healthy enough in mind and body to be active! I am also active in many other area and still look after a lot of web sites - you can find an index ((here)) |
|
Java - Memory Allocation and garbage collection
When you're running a dynamic application (and most of the languages we teach these days are dynamic), memory is allocated and released as necessary at run time, with allocation happening 'as required' and being released from time to time by a garbage collector - there is no point is collecting a few bytes of memory every time that there is some released as that would be very inefficient - rather like calling out your local council to collect your rubbish every time you finished a packet of crisps. So if you look at a graph of memory usage, you'll see a saw-toothed shape like this: 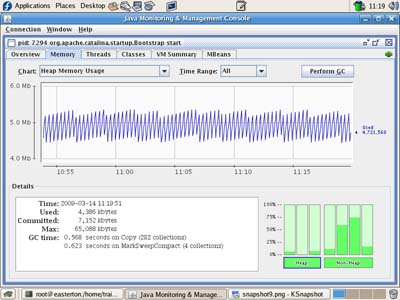 In Java, data (objects) are held in memory in different areas, and moved around between them, to make the memory management and garbage collection more efficient, and the memory areas each have their own names. In Java, data (objects) are held in memory in different areas, and moved around between them, to make the memory management and garbage collection more efficient, and the memory areas each have their own names.New objects are allocated memory in the Eden Space memory pool (as in created in Eden) and by the nature of most applications in which the majority of objects only survive for a short while, that's where they remain for their short lives. Here is a graph showing the size of Eden Space alone - you'll notice the same general saw toothed shape, but the curve drops virtually to zero at the base of every tooth: 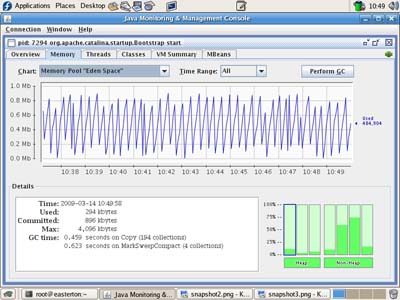 At minor garbage collection time, objects which survive garbage collection are moved to the Survivor Space which, as the name implies, is used for objects that have a longer life span / expectancy. Here's a graph of survivor space - you'll see some gentle ups and downs but in general a much smoother curve! At minor garbage collection time, objects which survive garbage collection are moved to the Survivor Space which, as the name implies, is used for objects that have a longer life span / expectancy. Here's a graph of survivor space - you'll see some gentle ups and downs but in general a much smoother curve!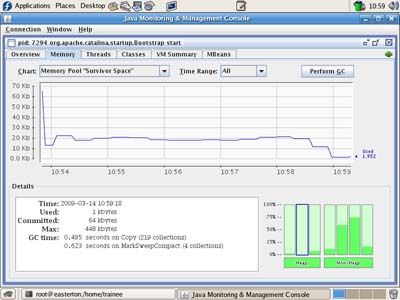 And that minority of objects that aren't going to be going away but are 'around for the duration' become a part of the Tenure space. I wouldn't describe the graph for tenure as a curve - more like a straight line! And that minority of objects that aren't going to be going away but are 'around for the duration' become a part of the Tenure space. I wouldn't describe the graph for tenure as a curve - more like a straight line!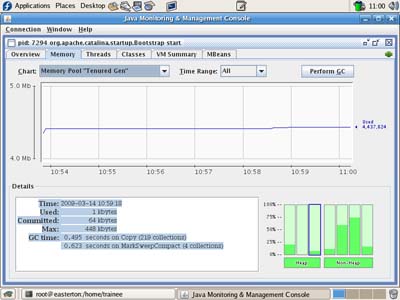 All four sample graphs are taken from jconsole, monitoring a Tomcat server that's ticking over with just a few test connections / pages being served. All four sample graphs are taken from jconsole, monitoring a Tomcat server that's ticking over with just a few test connections / pages being served.There are also other memory pools used and shown by jconsole - there's the code cache where the code that's being run - both Tomcat itself and the classes it is running - resides, and you have permanent areas too - one "rw" (read / write) and one that is "ro" (read only). The code cache graph looks somewhere between the survivor and tenure in shape: 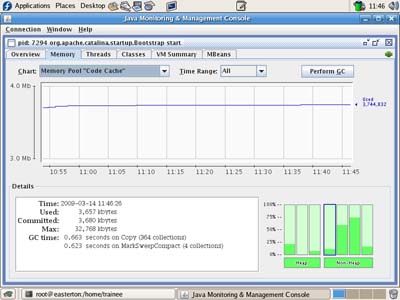 And the permanent areas are close to being flat files (I haven't reproduced them here!) And the permanent areas are close to being flat files (I haven't reproduced them here!)(written 2009-03-14, updated 2012-10-13) Associated topics are indexed as below, or enter http://melksh.am/nnnn for individual articles A901 - Replaced Page[1370] Apache Tomcat Performance Tuning - (2007-09-29) [1718] Increasing Java Virtual Machine memory for Tomcat - (2008-07-24) [2272] Monitoring and loading tools for testing Apache Tomcat - (2009-07-07) A692 - Web Application Deployment - Monitoring and load testing your server [2080] Using ApacheBench and jconsole to test and monitor Tomcat - (2009-03-14) [2082] Jmeter - a first test case - (2009-03-14) [3015] Logging the performance of the Apache httpd web server - (2010-10-25) [3019] Apache httpd Server Status - monitoring your server - (2010-10-28) [3027] Server logs - drawing a graph of gathered data - (2010-11-03) A506 - Web Application Deployment - Java - Installing and Deploying optional Technologies [2081] Connecting jconsole remotely - the principles - (2009-03-14) [3043] Gathering information - logging - with log4j. First steps. - (2010-11-12) A503 - Web Application Deployment - Java - Sourcing, Installing, Initial Testing [1908] Java CLASSPATH explained - (2008-11-26) [2153] Class Loading and Variable Conversion in Java - (2009-05-02) [2184] Choosing the right version of Java and Tomcat - (2009-05-16)
Some other Articles
Do you support a decent train service? Please sign up!Java - Memory Allocation and garbage collection A lot has changed - but the memory lingers on Why put Apache httpd in front of Apache Tomcat A New Advert for Well House Manor Supporting Parkinsons and Trains Weekday or Weekend PHP, Python and Perl classes? |
4759 posts, page by page
Link to page ... 1, 2, 3, 4, 5, 6, 7, 8, 9, 10, 11, 12, 13, 14, 15, 16, 17, 18, 19, 20, 21, 22, 23, 24, 25, 26, 27, 28, 29, 30, 31, 32, 33, 34, 35, 36, 37, 38, 39, 40, 41, 42, 43, 44, 45, 46, 47, 48, 49, 50, 51, 52, 53, 54, 55, 56, 57, 58, 59, 60, 61, 62, 63, 64, 65, 66, 67, 68, 69, 70, 71, 72, 73, 74, 75, 76, 77, 78, 79, 80, 81, 82, 83, 84, 85, 86, 87, 88, 89, 90, 91, 92, 93, 94, 95, 96 at 50 posts per pageThis is a page archived from The Horse's Mouth at http://www.wellho.net/horse/ - the diary and writings of Graham Ellis. Every attempt was made to provide current information at the time the page was written, but things do move forward in our business - new software releases, price changes, new techniques. Please check back via our main site for current courses, prices, versions, etc - any mention of a price in "The Horse's Mouth" cannot be taken as an offer to supply at that price.
Link to Ezine home page (for reading).
Link to Blogging home page (to add comments).
PH: 01144 1225 708225 • EMAIL: info@wellho.net • WEB: http://www.wellho.net • SKYPE: wellho
PAGE: http://www.wellho.net/mouth/2079_Jav ... ction.html • PAGE BUILT: Sun Oct 11 16:07:41 2020 • BUILD SYSTEM: JelliaJamb