
|
Training, Open Source Programming Languages This is page http://www.wellho.net/mouth/2992_Mat ... mples.html Our email: info@wellho.net • Phone: 01144 1225 708225 |
| For 2023 (and 2024 ...) - we are now fully retired from IT training. We have made many, many friends over 25 years of teaching about Python, Tcl, Perl, PHP, Lua, Java, C and C++ - and MySQL, Linux and Solaris/SunOS too. Our training notes are now very much out of date, but due to upward compatability most of our examples remain operational and even relevant ad you are welcome to make us if them "as seen" and at your own risk. Lisa and I (Graham) now live in what was our training centre in Melksham - happy to meet with former delegates here - but do check ahead before coming round. We are far from inactive - rather, enjoying the times that we are retired but still healthy enough in mind and body to be active! I am also active in many other area and still look after a lot of web sites - you can find an index ((here)) |
|
Matplotlib - graphing in Python - teaching examples
Matplotlib provides Python with a graph drawing and data representation tool that is extremely flexible - in fact so flexible that it's hard for the newcomer to know where to start. The following examples are very straightforward, but useful, graphs showing real data sets (from the second example onwards) of accesses to our web server last week, plotted against hour of the day. You'll be able to use almost identical code for your first experiments with matplotlib! The source code links each open in a separate window so that you can see the program and results at the same time 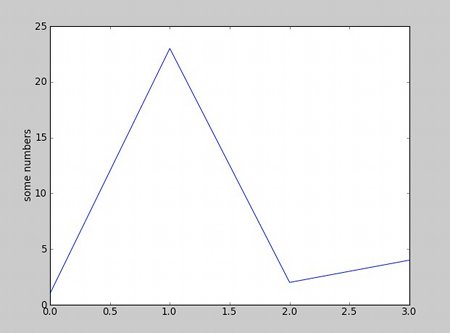 This is a first "hello matplotlib world" type example that shows fundamental graphing of a data set. [source] This is a first "hello matplotlib world" type example that shows fundamental graphing of a data set. [source]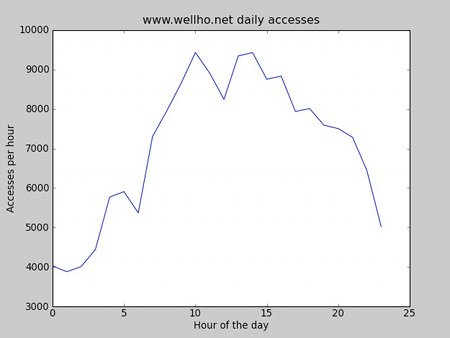 In this second example, we have added some labelling and we're using a real data set. The line style and much of the rest remain at defaults. [source] In this second example, we have added some labelling and we're using a real data set. The line style and much of the rest remain at defaults. [source]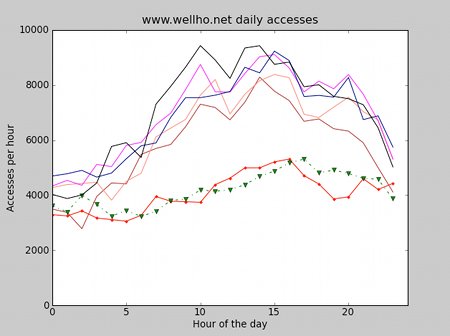 Plotting differet data sets on the same axes, using a variety of line styles to tell them apart. [source] Plotting differet data sets on the same axes, using a variety of line styles to tell them apart. [source]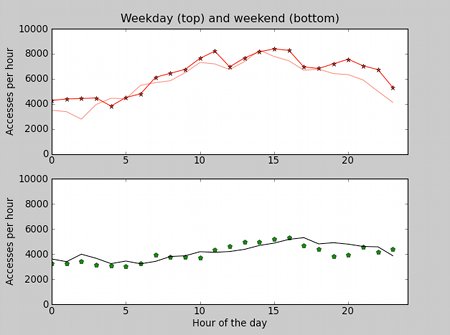 I've now added a second graph to the figure, so that you can see how different graphs can be combined. [source] I've now added a second graph to the figure, so that you can see how different graphs can be combined. [source]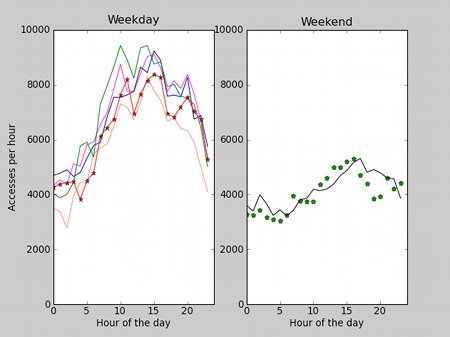 Finally, the two graphs have been adjusted so that they're left and right, and you'll now see some very significant differences in the weekend and weekday pattern. Truely, a picture paints a thousand words.[source] Finally, the two graphs have been adjusted so that they're left and right, and you'll now see some very significant differences in the weekend and weekday pattern. Truely, a picture paints a thousand words.[source]Matplotlib is huge - you can do a lot with it, and it's a daunting task at first to find what you need; the above should help newcomers who already have a grounding in Python programming. There's an excellent reference manual once you get deeper in, and you may find the following useful too: [link]Matplotlib HowTo FAQ [link]Matplotlib Colours Interface [link]PyPlot Tutorial (written 2010-10-10) Associated topics are indexed as below, or enter http://melksh.am/nnnn for individual articles Y118 - Python - numpy, scipy and matplotlib[2990] What are numpy and scipy? - (2010-10-09) [2991] Loading and saving data - Python / numpy - (2010-10-09) [2993] Arrays v Lists - what is the difference, why use one or the other - (2010-10-10) [2997] 3D graphics - web site usage - simple matplotlib and python example - (2010-10-12) [3554] Learning more about our web site - and learning how to learn about yours - (2011-12-17) [4440] A first graph with Matplotlib in Python - (2015-02-22) [4445] Graphing presentations in Python - huge data, numpy and matplotlib - (2015-02-28) Q913 - Object Orientation and General technical topics - Computer Graphics Principles [2245] Client side (Applet) and Server side (Servlet) Graphics in Java - (2009-06-17) [2633] Why do I teach niche skills rather than mainstream? - (2010-02-13) [2758] But what will you DO with all those pictures? - (2010-05-09) [3049] Computer Graphics is fun - even if Java Applets are Old Hat - (2010-11-13) [3148] OpenGL / C / C++ - an example to get you started - (2011-01-26) [3211] Computer Graphics in PHP - World (incoming data) to Pixel (screen) conversion - (2011-03-24) [3261] Scalable Vector Graphics - easy, low bandwidth, high resolution, dynamic. - (2011-04-23) [3262] Some SVG Elements, pixel and percent positioning - (2011-04-24)
Some other Articles
Copying - duplicating data, or just adding a name? Perl and Python comparedA river in Melksham is not just for boaters. Python - some common questions answered in code examples Matplotlib - graphing in Python - teaching examples Oddballs in Plymouth Not mugged in London! Memorial to a day in 1999 |
4759 posts, page by page
Link to page ... 1, 2, 3, 4, 5, 6, 7, 8, 9, 10, 11, 12, 13, 14, 15, 16, 17, 18, 19, 20, 21, 22, 23, 24, 25, 26, 27, 28, 29, 30, 31, 32, 33, 34, 35, 36, 37, 38, 39, 40, 41, 42, 43, 44, 45, 46, 47, 48, 49, 50, 51, 52, 53, 54, 55, 56, 57, 58, 59, 60, 61, 62, 63, 64, 65, 66, 67, 68, 69, 70, 71, 72, 73, 74, 75, 76, 77, 78, 79, 80, 81, 82, 83, 84, 85, 86, 87, 88, 89, 90, 91, 92, 93, 94, 95, 96 at 50 posts per pageThis is a page archived from The Horse's Mouth at http://www.wellho.net/horse/ - the diary and writings of Graham Ellis. Every attempt was made to provide current information at the time the page was written, but things do move forward in our business - new software releases, price changes, new techniques. Please check back via our main site for current courses, prices, versions, etc - any mention of a price in "The Horse's Mouth" cannot be taken as an offer to supply at that price.
Link to Ezine home page (for reading).
Link to Blogging home page (to add comments).
PH: 01144 1225 708225 • EMAIL: info@wellho.net • WEB: http://www.wellho.net • SKYPE: wellho
PAGE: http://www.wellho.net/mouth/2992_Mat ... mples.html • PAGE BUILT: Sun Oct 11 16:07:41 2020 • BUILD SYSTEM: JelliaJamb